What Commuting Patterns Reveal About Wasatch Front Communities
June 16, 2026
What is the Commuter Flow Map?
WFRC’s newly updated Utah Commuter Flow Map uses anonymized employment data from the U.S. Census Bureau’s Longitudinal Origin Destination Employment Statistics (LODES) dataset to display commuting patterns between communities across the Wasatch Front. By aggregating home-to-work connections for each city, the commuter flow map shows where residents work, where workers travel from, and how many people live and work in the same community. This tool can help local leaders and planners understand regional travel patterns, compare commuting trends between cities, and begin to contemplate opportunities to help residents reach jobs more easily.

Three questions you can answer with this map:
1) What share of residents in my city don’t leave the city to get to their workplace?
While it is not reasonable to expect all residents to work in the city where they live, nearby job opportunities lead to shorter commutes, adding free time to residents’ lives and money to their wallets as they save on fuel and maintenance expenses. Nearby employment can also make other commuting options like transit, biking, and walking more practical. These factors can also mitigate demand on major roadways.
- For example, 35% of the 42,000 workers who live in Ogden have jobs located in Ogden. This measure varies widely for other cities in our region, from as low as 2% to as much as 50%.

2) Where do residents in my city commute to?
The commuter flow map reveals important economic linkages between Wasatch Front communities. Traditional job centers — like downtown Salt Lake, Provo, and Ogden — remain very important. However, among residents who commute outside their own community for work, more workers travel to other cities than to our region’s primary downtown centers. Other, non-downtown employment districts with specializations in technology, manufacturing and distribution, education, and research, taken collectively, continue to be important destinations.*
- For workers commuting from Tooele City, Salt Lake City is the most common single destination, but far more workers head to other Wasatch Front cities combined than to Salt Lake City (10,186 vs. 4,192).

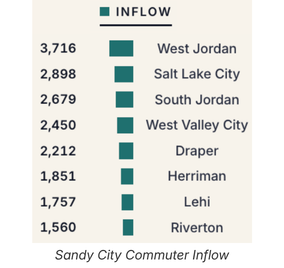
3) What cities send workers to my city?
While a city’s residents are its most immediate constituents, workers from other communities also benefit from transportation and other improvements made to their workplace city and along the transportation corridors that get them to their jobs. They also contribute to a city’s tax base when they make purchases near their work location.
- 46,000 workers commute from other cities into Sandy City, including over 2,000 workers each from West Jordan, Salt Lake City, South Jordan, West Valley City, and Draper.
Why Jobs-Housing Balance Matters
Improving the balance of jobs, housing, and amenities makes it easier for residents to connect to what they need closer to home, putting less strain on existing roads and stretching future transportation investments.
Adding nearby jobs and attractions decreases the pressure that longer commutes and other travel put on our road system. As the cost of building new roads and expanding transit continues to rise, it is important to look for solutions that can reduce the need for longer commutes. Commuting trips are especially important because peak-period congestion is the primary driver for most road expansion projects. drives the primary need for the most expensive transportation projects.
One strategy for shortening overall commuting distance is pursuing a better balance between housing and job locations. This can be accomplished by attracting more jobs to predominantly residential areas, building more housing near existing or emerging employment centers, and supporting the development of mixed-use city and town centers.
Utah’s continued investment in roads, transit service, and other transportation improvements has helped create one of the strongest transportation networks in the country. One of the biggest benefits of these investments is helping people get to work and back efficiently. But as the Wasatch Region continues to grow, transportation planning should increasingly consider where people live, where jobs are located, and how to develop the right balance that best sustains our overall quality of life.
What to Go Deeper?
The current version of the Commuter Flow Map has statewide coverage and displays LODES data from 2023, the latest available from the Census Bureau. A timeslider in the upper right corner of the map lets users explore past years’ data going as far back as 2002.
The map also allows users to explore county-level commute flows. This table provides an overview of commuting characteristics for each county along the Wasatch Front and Back:
| County | Workers Live and Work Within County | Workforce Commuting in from Other Counties | % of Residents with a Commute of Less than 20 Minutes | % of Residents with a Commute of Less than 10 Miles |
|---|---|---|---|---|
| Box Elder | 37% | 47% | 50% | 27% |
| Davis | 37% | 52% | 46% | 46% |
| Morgan | 23% | 52% | 36% | 25% |
| Salt Lake | 83% | 35% | 45% | 64% |
| Summit | 46% | 65% | 47% | 41% |
| Tooele | 25% | 43% | 37% | 23% |
| Utah | 62% | 31% | 52% | 45% |
| Wasatch | 28% | 51% | 46% | 33% |
| Weber | 52% | 45% | 47% | 57% |
We are always happy to help you use the tools we develop. If you have questions, feel free to reach out to our Analytics Team at analytics@wfrc.utah.gov.
*Note: the Census LODES dataset does not fully include military-related employment; with Hill AFB commuting not accurately represented, it has been excluded from our commuter flow map.