Access to Opportunities
What is Access to Opportunities?
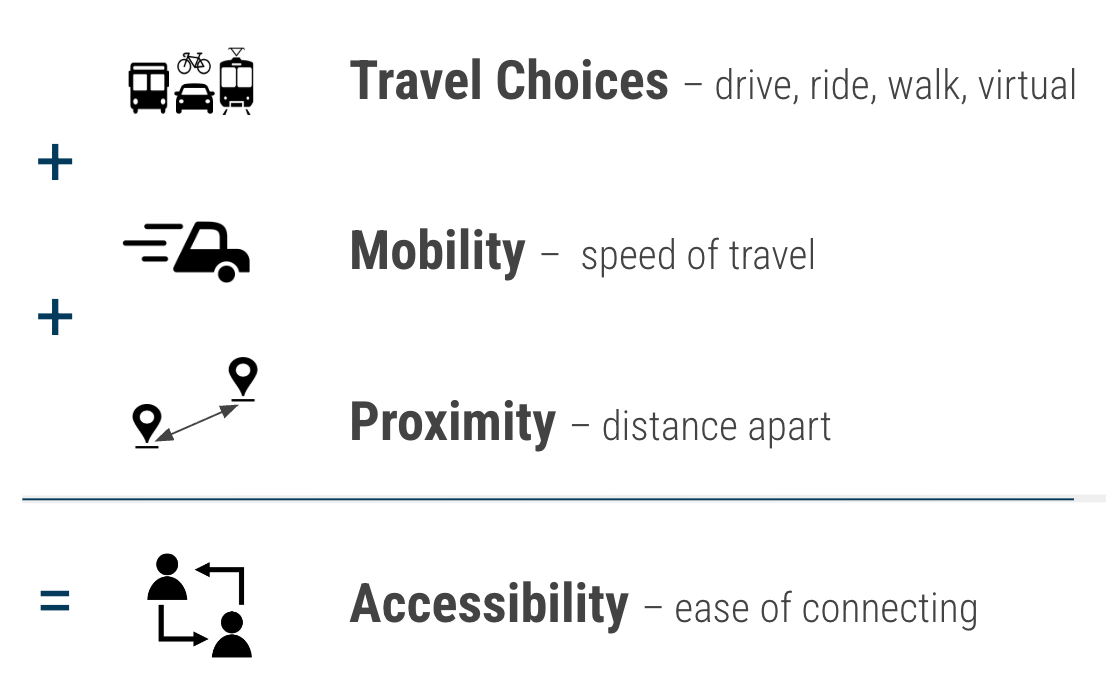
Consideration of current and future ATO is important to the development and implementation of the Wasatch Choice Vision for our region. A high-level goal is to maximize residents' ability to efficiently connect to their daily needs and other amenities which means factoring in transportation choices, the distance between key destinations, and the speed at which we travel. More broadly, ATO metrics quantify how well the current and future transportation system works with land use to help our economy thrive.
More directly, increased accessibility can have significant impacts on overall community livability while improving individuals’ connections to the things that foster upward mobility — education, employment, healthcare, social services, and other basic amenities. ATO serves as a guide for WFRC and its partner organizations, as we collectively pursue the best possible transportation plans and land use decisions in support of community choice and economic vitality.
How Do We Measure ATO?
ATO can be assessed using a variety of frameworks and scales.
Regional Access to Opportunities
- At a regional scale, Access to Opportunities is a metric that can be estimated and forecasted using the regional Travel Demand Model, and the results can be visualized in map form using geographic information systems (GIS).
- WFRC developed the GIS-based ATO Impact Tool to calculate simpler ATO gain metrics for small and medium-sized transportation and land use projects. The ATO Impact tool make use of ArcGIS Pro’s network analyst and open-sourced python notebooks, together with a multimodal transportation network and TAZ-based household and job intensity, and simplified assumptions about how new projects change workplace accessibility measures. For more info about this tool, contact analytics@wfrc.org.
- WFRC’s ATO TAZ-based measures combine the performance of the transportation system during rush hour, and factor in the distribution of households and workplaces around the region.
- ATO describes the efficiency of how metro area residents travel between home, work and other desired destinations.
- ATO can be used to describe key labor market components – the average number of jobs that are reachable to a resident within a set travel time, or the number of employees or households a firm or business might draw if located within a specific place. In both cases, the pattern and intensity of development and the transportation system have a significant impact.
- Both shorter travel times and an increased presence of employment and other opportunities result in higher accessibility scores. Travel times can be shortened by improving one or more of the following: proximity of destinations to homes, enhanced transit service, or a reduced road congestion.
- WFRC land use and travel models allow for the accessibility impacts of land use decisions and transportation enhancements to be forecasted and explored a decade or more into the future.
Local Access to Opportunities
- At a local scale, where an individual city or neighborhood is considered, Access to Opportunities can be measured in finer detail than the regional Travel Demand Model provides, and can consider additional travel modes such as biking and walking.
- Local accessibility metrics consider a wider range of destinations including the locations where important goods, services, and activities can be obtained. In short, this is the ease with which we can reach existing amenities that help support livability, such as grocery stores, health care facilities, parks and public spaces, or a transit stop that links residents to employment, goods and services. Accessibility in this sense is best where there is a mix of land uses at the neighborhood scale, good street connectivity, and a safe walking environment.
Access to Opportunities Metrics and Data
Access to Opportunities (ATO) metrics are a family of measures that describe how well the region’s household, employment, and goods/service locations are connected to each other by the transportation system. WFRC has developed several methods to quantify ATO within the region and is working on a few additional measures.
Workplace ATO Measures (TAZ-level)
The regional travel demand model calculates workplace accessibility for both auto and transit modes at the transportation analysis zone (TAZ) level. The TAZ-based ATO metrics take into account: 1) our region’s distribution of households and jobs, 2) travel time to the workplace during the peak commute hours, and 3) a weighting that fully counts nearby opportunities and discounts others in proportion to how far away they are.
TAZ-level ATO metrics can be viewed from the perspective of households connecting to jobs, or from the perspective of employers and businesses seeking accessibiloity for their workforce or customers. The metrics can be calculated regionwide or specific to smaller areas to better see local variation in accessibility.
WFRC's TAZ-based Workplace WFRC ATO web map is a great resource are for exploring regional ATO. This map viewer let's users visualize current and projected future workplace ATO for both auto and transit, and provides trend lines for each TAZ that factor in future land use and transportation system performance. The ATO webmap also has the ability to display ATO adjusted for to specific subregions of the Wasatch Front (ex. Northern Davis County).

WFRC developed a grid-based Access To Opportunities map layer for the region to support a portion of the scoring system used to prioritize local transportation projects for funding programmed by WFRC as part of the Transportation Improvement Program (TIP).
This grid-based ATO metric, termed Commute Source Intensity, considers both job and housing densities within approximately 1/4 mile of a project of each grid cell. The grid-based approach — wherein each cell is about the size of a downtown city block — is a simple, easy to understand method that is appropriate for local scale analysis. The Commute Source Intensity GIS polygon dataset available for download from data.wfrc.org.

WFRC has collaborated with Mountainland Association of Governments (MAG), UDOT, UTA, and UGRC (Utah’s state GIS office) to create and sustain a multimodal GIS dataset of the transportation network, including roads, transit, and bike lanes, and bike/ped pathways.
The multimodal network dataset, together with GIS data depicting the location of schools, groceries, community centers, health care and social service providers, and parks, are used in ATO analysis at a neighborhood scale.

The Housing Site Evaluator can assist housing and land use planning efforts throughout the greater Wasatch Front. This tool is intended to be used as a conversation starter, helpful visualization, and data-informed guide about access and planning for housing opportunities. Users choose what factors are important to their community and prioritize them. The tool produces a heat map of most to least suitable locations based on the user’s prioritization.

How does WFRC use this measure in our planning efforts?
Since 2017, WFRC has made a significant effort to operationalize Access to Opportunities (ATO) measures to better link transportation, land use, and economic development. These include:
- A performance-based planning system was defined and implemented for the 2019-2050 Regional Transportation Plan. As a result, ATO metrics were incorporated into scenario evaluation and project prioritization scoring for roadway, transit, and active transportation projects.
- ATO was approved by Trans Com, starting in FY19, as a component of project technical scores (15%) for Surface Transportation Program project funding that is competitively awarded by WFRC.
- The Wasatch Front Economic Development District (WFEDD) adopted Access to Opportunities as a key economic development strategy. It is expected that ATO metrics will be monitored over time to gauge progress within the region.
- The ATO framework and supporting data resources continue to be a focal point for workshops and other WFRC outreach efforts with cities and counties in our region.
Strategies for increasing access
An Access to Opportunities measure can facilitate decision-making for and beyond transportation planning. For example, the measure can also be useful in home purchasing, businesses or government facilities site selection, and in supporting upward socioeconomic mobility. Cities and developers can improve access to opportunity in myriad ways, such as mixing uses and clustering growth near high speed and high frequency transit.
Land-use solutions that improve Access to Opportunities include:
- Growth centers near high-capacity transportation,
- Higher densities,
- Intermixing homes and jobs, and
- Street design that encourages local investment along the street.
Transportation solutions that can improve Access to Opportunities include:
- Reduced congestion,
- A more connected street network,
- Increased transit frequency and coverage,
- Bicycle and pedestrian connections, and
- Higher travel speeds on key commuter (non-neighborhood) routes.
Resources
- Workplace Access to Opportunities: interactive map | GIS data
- Housing Accessibility: interactive map | overview
Contact
For additional information, please contact:

WFRC Analytics Team
(general inquiries)